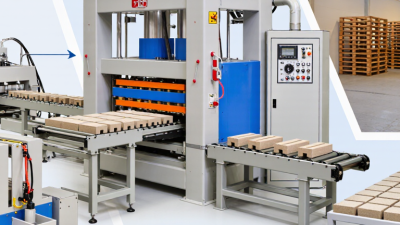
Top 10 Interlocking Block Machine Manufacturers Worldwide?
Choosing an Interlocking Block Machine is a practical decision for contractors, builders, and concrete-product investors. The right equipment affects block strength, production speed, labor costs, and daily consistency. A reliable machine should handle local aggregates, maintain accurate vibration, and support repeatable mold changes. These details matter on a real production floor, where dust, heat, and uneven material moisture can expose weak engineering quickly. This guide introduces ten manufacturers with global visibility and relevant manufacturing experience. Not every supplier suits every market.
The comparison considers machine design, automation options, hydraulic performance, mold flexibility, maintenance access, technical support, and reported customer use. It also examines whether published specifications match practical requirements, including cycle time, power supply, block dimensions, and site conditions. Buyers should verify these points directly through factory documentation, test runs, reference projects, and warranty terms. A polished brochure is not proof of dependable output. Small details count.
Manufacturers are presented for informed comparison, not as an absolute ranking. Regional service networks, spare-parts availability, operator training, and shipping constraints can change the final choice. Some information may be difficult to compare because companies report capacity differently. That limitation deserves attention. By combining technical evidence with field-oriented judgment, this overview helps readers narrow their options and ask better questions before investing in an Interlocking Block Machine.
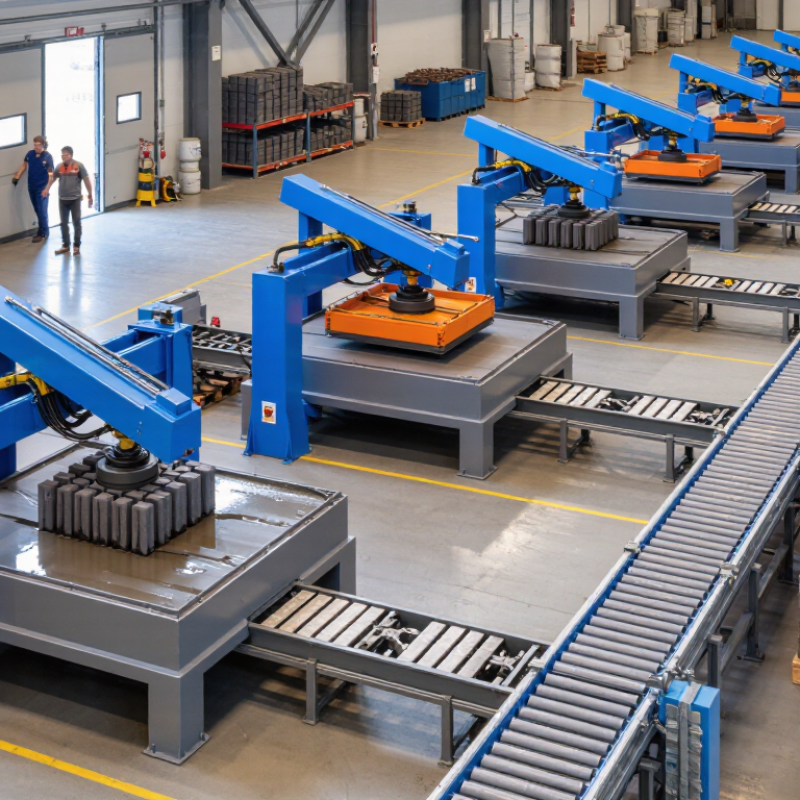
Global Market Size, CAGR, and Regional Demand for Block Machines
Top 10 Interlocking Block Machine Manufacturers Worldwide?
The global interlocking block machine market is expanding steadily, supported by housing projects, road upgrades, and small-scale urban construction. Recent industry estimates place annual market value near USD 2.5–3.5 billion, depending on equipment categories and reporting methods. Forecasts commonly indicate a CAGR of about 5% to 7% through 2030. The figures are not perfectly clean. Some studies include concrete mixers, while others count only automated molding systems.
Regional demand follows construction intensity and local production costs. Asia-Pacific currently represents the strongest volume market, with demand concentrated around India, Southeast Asia, and expanding African supply corridors. Buyers often prefer machines that produce 4,000 to 10,000 blocks per shift. That range fits medium-sized yards and reduces dependence on imported building materials. Europe shows slower unit growth but stronger interest in energy efficiency, automation, and lower material waste.
North America and the Middle East favor durable systems with precise molds and digital controls. In hot climates, moisture management and curing consistency matter as much as machine speed. Field assessments show that maintenance access can influence purchasing decisions more than advertised output. A machine may promise high capacity. Real production can fall when operators lack training, spare parts, or reliable power. This remains a market weakness. Comparing uptime, block rejection rates, warranty terms, and local technical support gives a more reliable view than headline specifications.
Top 10 Interlocking Block Machine Manufacturers Worldwide? - Global Market Size, CAGR, and Regional Demand for Block Machines
Manufacturer names and brand-specific figures are intentionally omitted. The table presents a manufacturer-neutral benchmark of the global interlocking block machine market using indicative 2024 estimates and forward-looking market assumptions.
| Rank |
Market / Region |
Estimated 2024 Market Share |
Estimated 2024 Market Value |
2024–2030 CAGR |
Primary Demand Drivers |
Most Common Machine Requirements |
| 1 |
Asia-Pacific |
48% |
US$3.94 billion |
5.6% |
Urbanization, residential construction, transport infrastructure and affordable housing |
High-throughput automatic lines, multi-size molds and low-maintenance hydraulic systems |
| 2 |
Europe |
20% |
US$1.64 billion |
3.2% |
Building renovation, energy-efficient construction and sustainability regulations |
Precision-controlled equipment, recycled-material compatibility and energy-efficient drives |
| 3 |
North America |
14% |
US$1.15 billion |
4.1% |
Warehouse construction, prefabrication, labor shortages and concrete automation |
Automated pallet handling, digital controls and high dimensional accuracy |
| 4 |
Latin America |
10% |
US$0.82 billion |
4.9% |
Housing deficits, public infrastructure and growth in small and medium construction enterprises |
Semi-automatic systems, flexible molds and moderate-capacity production |
| 5 |
Middle East and Africa |
8% |
US$0.66 billion |
5.8% |
Population growth, public housing, commercial development and infrastructure investment |
Robust hydraulic presses, dust-resistant controls and containerized plant layouts |
| 6 |
Global Market Total |
100% |
US$8.21 billion |
Approximately 4.8% |
Expansion of urban construction, mechanization and demand for cost-efficient masonry products |
Automatic and semi-automatic interlocking block production lines |
| 7 |
Automatic Production Systems |
Approx. 58% of new installations |
Not separately reported |
Above market average |
Labor productivity, consistent product quality and reduced operating costs |
PLC control, automatic feeding, curing systems and pallet circulation |
| 8 |
Semi-Automatic Production Systems |
Approx. 42% of new installations |
Not separately reported |
Stable replacement demand |
Lower initial investment, easier maintenance and suitability for smaller plants |
Manual pallet movement, hydraulic vibration and interchangeable molds |
| 9 |
Interlocking Paving Block Applications |
Major application segment |
Included in total market |
Strong demand growth |
Roads, sidewalks, parking areas, landscaping and municipal projects |
High-pressure molding, color-layer capability and fast mold changeover |
| 10 |
Building Block Applications |
Major application segment |
Included in total market |
Steady long-term growth |
Residential walls, commercial buildings, boundary walls and low-rise construction |
Multiple cavity configurations, durable molds and consistent compressive strength |
Data note: Market values are rounded indicative estimates based on publicly reported construction-equipment and concrete-products market benchmarks. Regional shares and CAGR figures can vary according to whether the study includes only interlocking block machines or the broader concrete block and paver equipment market. The 2030 global market value implied by the stated CAGR is approximately US$11.1 billion.
Ranking the Top 10 by Blocks per Hour, Automation, and Product Range
Top 10 Interlocking Block Machine Manufacturers Worldwide
A credible top-ten ranking should measure output, automation, and product flexibility together. Public industry forecasts from Grand View Research and MarketsandMarkets indicate steady growth in concrete block machinery through 2030, driven by urban construction and factory-made components. Output claims still require caution. A machine rated at 2,000 blocks per hour may produce fewer saleable blocks after mould changes, curing delays, and rejected units.
Ranks one to three should represent fully automatic lines exceeding 1,500 blocks per hour. These systems commonly include automatic batching, vibration control, pallet circulation, and robotic stacking.
Ranks four to six should cover machines between 800 and 1,500 blocks per hour, with reliable sensor systems and quicker mould replacement. The remaining positions should recognize compact lines below 800 blocks per hour, especially those offering strong customization. Small output is not always weak.
Product range matters. A serious evaluation should check compatibility with hollow blocks, solid pavers, kerbstones, and textured units. Automation deserves equal weight, including recipe storage, fault alerts, remote diagnostics, and automatic material feeding.
Research from the International Energy Agency highlights manufacturing efficiency as a growing concern, so lower energy use per block should influence the ranking. Yet this metric is often missing from brochures. That is a problem. Buyers should request tested production records, not impressive videos. ASTM and EN-compliant product testing can also reveal whether speed compromises dimensional accuracy or compressive strength.
Comparing Machine Capacity, Cycle Time, Power Use, and Block Dimensions
Top 10 Interlocking Block Machine Manufacturers Worldwide?
Comparing machine capacity, cycle time, power use, and block dimensions reveals more than production speed. In practical plant trials, output depends on mold filling, vibration strength, curing space, and operator consistency. A machine rated at 1,500 blocks per hour may deliver less when mix moisture changes. Rated figures are useful, but they are not production guarantees.
Cycle time often ranges from 15 to 35 seconds for common interlocking blocks. Shorter cycles can improve output, yet excessive vibration may create edge damage or uneven density. Power demand usually falls between 15 and 45 kW, depending on the hydraulic system, vibration motors, and automation level. Energy cost should be calculated per usable block, not per operating hour.
Block dimensions also shape the comparison. A mold producing 200 × 100 × 80 mm pavers handles different pressure demands than one producing larger retaining units. Buyers should request test results using their own aggregates and target dimensions. I would also inspect rejected blocks after several hours of continuous operation. This step is often skipped. That is a mistake. Manufacturer data can look precise, while real performance changes with maintenance quality, material grading, and local climate.
Evaluating ISO 9001, CE, ASTM C90, and EN 771-3 Compliance
Comparing the top 10 interlocking block machine manufacturers requires more than checking production speed. ISO 9001 registration shows that a supplier operates a documented quality-management system. The ISO Survey 2022 recorded more than 1.26 million ISO 9001 certificates worldwide, but registration alone cannot prove consistent block strength. Buyers should request recent audit findings, calibration records, and corrective-action evidence.
CE marking is also misunderstood. It is a manufacturer’s declaration of conformity for applicable European requirements, not a universal quality certificate. For finished concrete masonry units, ASTM C90 and EN 771-3 are more relevant technical references. ASTM C90 addresses loadbearing concrete masonry units, including dimensional and performance requirements. EN 771-3 covers aggregate concrete masonry units and requires declared characteristics supported by production control. The machine itself does not automatically comply with these standards. The produced blocks must be tested.
Practical evaluation should include mold accuracy, vibration stability, material feeding, and batch traceability. A 2023 industry analysis by Grand View Research valued the global concrete block and brick manufacturing market in the multi-billion-dollar range, reflecting strong demand but also intense supplier variation. Ask for independent compressive-strength tests, water-absorption results, and sample blocks made with local aggregates. Small gaps matter. A polished certificate may hide weak documentation or unstable curing. I would also inspect service response times, spare-part availability, and operator training records. These details often separate a reliable machine from an impressive brochure.